
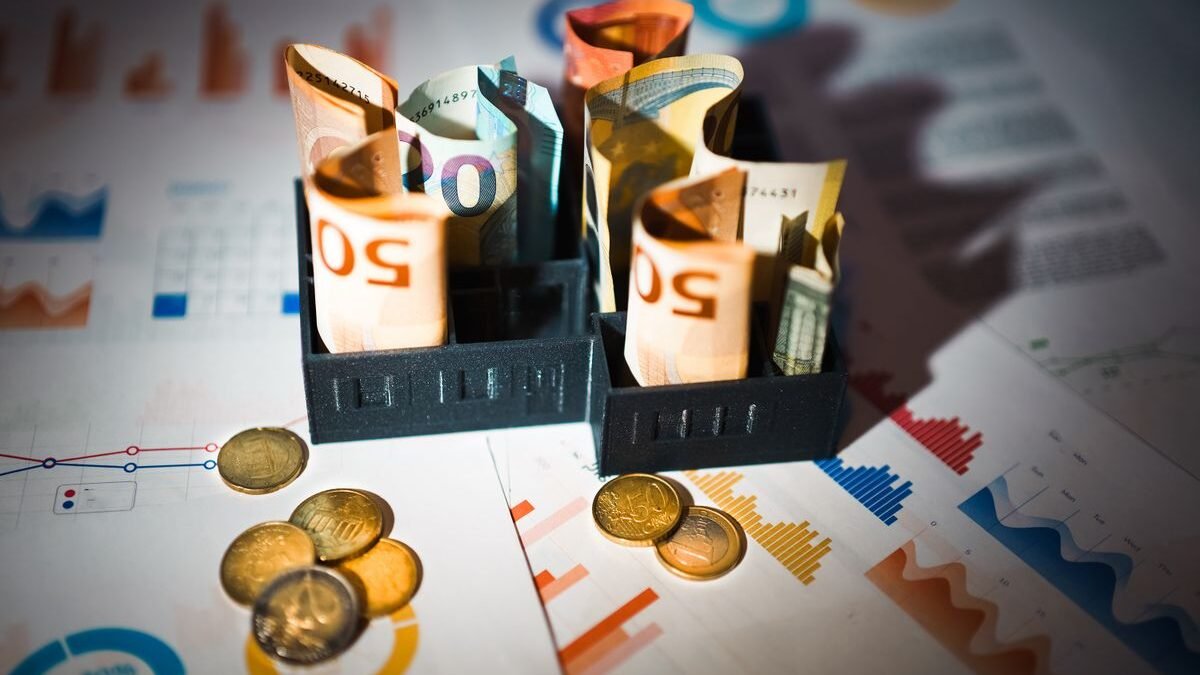
The European Union budget is one of the least understood institutions in European public life. Its scale is routinely exaggerated — EU budget contributions account for roughly 1% of member states’ gross national income, a fraction of what national governments spend. But the way that money is collected, allocated and spent has profound consequences for which regions develop, which industries are supported, and what political trade-offs are baked into the European project. Here is a clear breakdown of where the money comes from and where it goes.
How the EU raises its money
The EU budget is financed through four main sources, collectively called “own resources.” Traditional own resources — primarily customs duties collected at EU external borders on imported goods — contribute around 14% of the total. A share of VAT collected by member states contributes roughly 10%. The largest source, accounting for around 70% of the budget, is GNI-based contributions: each member state pays a share proportional to the size of its economy. A newer resource — a levy on non-recycled plastic packaging waste — was introduced in 2021.
The GNI-based contribution is effectively a national contribution system disguised as an “own resource” — it creates the net contributor/net recipient dynamics that dominate every budget negotiation, as examined in our EU budget fight analysis. Member states that pay more than they receive are net contributors; those that receive more than they pay are net recipients. Germany is consistently the largest net contributor; Poland is consistently the largest net recipient.
Where the money goes: the big three
The 2021–2027 Multiannual Financial Framework allocates commitments across several major headings. The three largest are cohesion and resilience (funding for regional development, transport infrastructure, social programmes and COVID recovery — around 35% of the framework budget); natural resources and environment (the Common Agricultural Policy plus rural development and environmental programmes — around 30%); and “single market, innovation and digital” (including Horizon research funding, digital infrastructure and the single market programme — around 10%).
The Common Agricultural Policy, which dates to the EU’s foundation in the 1960s, remains the single largest programme in percentage terms when combined with rural development funding. It provides direct income support to European farmers (the majority of CAP spending), market intervention mechanisms, and rural development investment. The CAP’s persistence as a large budget item reflects the political influence of farming communities across member states, and particularly France’s consistent defence of agricultural support.
Cohesion funds: the EU’s regional development engine
The EU’s structural and cohesion funds — the European Regional Development Fund, the European Social Fund Plus, and the Cohesion Fund — channel investment toward less developed regions and member states. The underlying logic is convergence: richer regions and countries should help poorer ones develop, both for reasons of solidarity and because economic convergence strengthens the single market. The evidence that cohesion policy works is generally positive, though hotly debated in the economics literature. Polish and Baltic state development since 2004 benefited significantly from structural fund investment; whether that investment was the cause or a contributing factor is contested.
EU budget transparency has improved significantly in the digital era. The Commission’s financial transparency system publishes every payment above €500, allowing journalists, researchers and citizens to track exactly who receives EU money and for what purpose. Investigations using this data have revealed cases of EU funds flowing to companies connected to political insiders in several member states — a transparency that creates accountability pressure even when enforcement is slow.